[:el]Generate new revenue through subscription and ad-insertion business models
Introduction
“That’s great! But what does it do for me,” is a refrain of frustration that Video Service Providers (VSPs) are increasingly evoking as they roll out new IP video services to satisfy their customers’ TV Everywhere cravings. These services, based on unicast transmission of video to consumer devices, such as tablets, PCs, mobile phones, or set-top boxes (STBs), have become a market necessity for VSPs largely due to competitive pressure and to guard against subscriber churn. But many VSPs are now discovering that these new services are more than just a tool for promoting customer loyalty but an emerging source of additional ARPU (average revenue per user). This paper explains how VSPs can generate new revenue through the thoughtful monetization of new IP Video services that are capable of scaling gracefully and delivering a quick return of investment.
Service Types
This paper is focused on three separate IP-based, Over-the-Top (OTT) services: linear video, Video on Demand (VOD) and Cloud DVR. These services are capable of generating revenue via subscriptions, transactions, or through ad-insertion, as illustrated in Figure 1.

To demonstrate the scale of achievable revenue, this report focuses on a hypothetical VSP with 250,000 subscribers to its linear video service. While revenue results will scale linearly with subscribers numbers, the goal of this document is to show that even a small VSP can generate significant revenue through IP-based services.
These services can also be used to upsell adjunct offerings, such as telephony and security/monitoring. Though an additional source of potential revenue, these adjunct services are beyond the scope of this paper. In addition, this document does not estimate revenue generation through transaction-oriented services, which are dependent on multiple factors.
Subscription Services
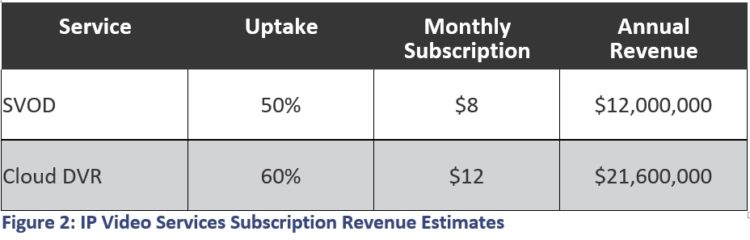
A subscription model, which automates an annual or monthly purchasing decision, is beneficial to both consumers and service providers. Figure 2 summarizes typical North American subscription pricing and service uptake rates. These services have different deployment costs, with cloud DVR being the most expensive due to high storage requirements (specifically in North America, where each subscriber’s recordings have to be stored independently). Even in this case, the ROI is measured in months
Transaction Services
Revenue from transactional services, which can be lucrative, is difficult to estimate. A VSP’s potential for success in this area is dependent on multiple factors, such as access to premium sporting events or premium content. A potential windfall for VSPs is emerging interest among content owners to monetize early release window content, e.g. movies that are still playing in theaters. Transactions of this sort can bring in very high fees. But roll-outs are complicated by many factors, including fears of piracy and negotiations with theater distribution channels.
Ad Insertion
For linear television, VSPs share ad opportunities with content owners, each inserting ads on some of the available ad spots. In the North American cable market alone, this is a $60 billion business.
Figure 3 summarizes typical assumptions for factors that influence the return associated with local ad insertion by a VSP.
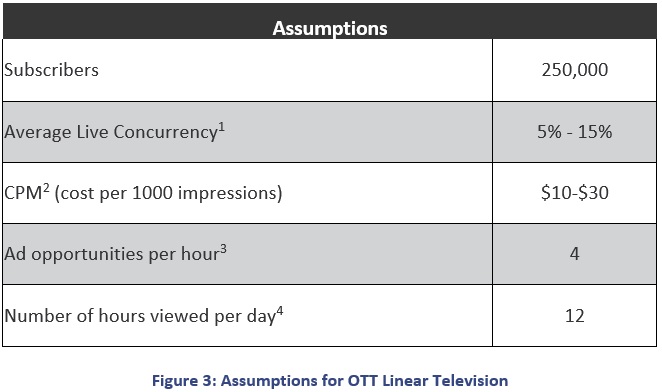
Note the following clarifications about these assumptions:
- Set-Top Box (STB) peak live concurrency is 50-60%, but multiscreen is typically less.
- CPMs can be higher than presented here, especially as targeting improves. Because these services are unicast, every subscriber can potentially be targeted by more suitable ads than in broadcast, for example.
- Out of the typical 12 minutes per hour of advertising, about 2 minutes is shared with VSPs, leading to 4 ad opportunities.
- This is a conservative estimate of the average number of total hours that are viewed at the average live concurrency (not the average hours viewed per viewer).
Figure 4 uses the OTT linear television assumptions to show associated return. Figure 4 illustrates that even moderate assumptions on either concurrency or CPM can yield significant return.
| Concurrency |
CPM |
Annual Revenue |
ARPU |
| 5% |
$10 |
$2,190,000 |
$8.76 |
| 5% |
$20 |
$4,380,000 |
$17.52 |
| 5% |
$30 |
$6,570,000 |
$26.28 |
| 15% |
$10 |
$6,570,000 |
$26.28 |
| 15% |
$20 |
$13,140,000 |
$52.56 |
| 15% |
$30 |
$19,710,000 |
$78.84 |
| Figure 4: Annual Revenue & ARPU Estimates for OTT Linear Television Ad Insertion |
For cloud DVR services, relevant assumptions are shown in Figure 5.
| Assumptions |
| Subscribers |
250,000 |
| Average cloud DVR Concurrency1 |
1% – 6% |
| CPM2 |
$10-$30 |
| D4 Ad opportunities per hour3 |
24 |
| C3 Ad opportunities per hour |
4 |
| Number of hours viewed per day4 |
10 |
| Percentage of D4 assets5 |
25% |
| Figure 5: Cloud DVR Assumptions |
Note the following clarifications about these assumptions:
- Peak cloud DVR viewing concurrency can hit 20%, but average concurrency over the day is much lower.
- CPMs can be much higher than assumed here, especially as targeting improves.
- After the so-called C3 window (72 hours), all ads can be replaced. C3 ads typically count toward the original live campaign. In our estimates, we count both the C3 campaign (which has fewer ad opportunities, since only the fewer replaced ad opportunities can be monetized) and the subsequent day 4 (D4) campaign (where all the original ad opportunities can be monetized).
- This is a conservative estimate of the average number of total hours in a day that are viewed at the average cloud DVR concurrency (not the average watched per viewer).
- About 75% of all assets are viewed during the C3 window (72 hours). This is what’s left.
Figure 6 shows the returns associated with the above assumptions and illustrates the lucrative revenue potential of cloud DVR services.
| Concurrency |
CPM |
Annual Revenue |
ARPU |
| 1% |
$10 |
$821,250 |
$3.29 |
| 1% |
$20 |
$1,642,500 |
$6.57 |
| 1% |
$30 |
$2,463,750 |
$9.86 |
| 3% |
$10 |
$2,463,750 |
$9.86 |
| 3% |
$20 |
$4,927,500 |
$19.71 |
| 3% |
$30 |
$7,391,250 |
$29.57 |
| 6% |
$10 |
$4,927,500 |
$19.71 |
| 6% |
$20 |
$9,855,000 |
$39.42 |
| 6% |
$30 |
$14,782,500 |
$59.13 |
| Figure 6: Annual Revenue & ARPU Estimates for Cloud DVR Ad Insertion |
For ad-supported VOD services, the revenue is smaller. The assumptions are illustrated in Figure 7.
| Assumptions |
| Subscribers |
250,000 |
| Average cloud DVR Concurrency1 |
3% |
| CPM2 |
$10-$30 |
| Ad opportunities per hour3 |
6 |
| Number of hours viewed per day4 |
2 |
| Figure 7: OTT VOD Assumptions |
Note the following clarifications about these assumptions:
- Peak AVOD concurrency can hit 20%, but average concurrency over the day is lower.
- CPMs can be much higher, especially as targeting improves.
- AVOD can’t support the same ad avails as recorded TV, though in some cases operators try to insert more ad opportunities than assumed here.
- VOD viewing is less than cloud DVR viewing.
The resulting revenue, based on the above assumptions, is lower than the estimates for either linear or cloud DVR services, as illustrated in Figure 8.
| CPM |
Annual Revenue |
| $10 |
$328,500 |
| $20 |
$657,000 |
| $30 |
$985,500 |
| Figure 8: Annual Revenue Estimates for Ad-Inserted VOD |
Conclusion
New OTT video services offer VSPs new and significant monetization opportunities. Based on fairly conservative assumptions, a VSP with 250,000 subscribers has the opportunity to generate annual revenue through new OTT services in the range of $30-$60 million annually. While this paper does not cover precise ROI timelines, it is not unreasonable to anticipate a rapid return of investment for services such as ad insertion and cloud DVR subscription, which offer potentially significant annual revenue.
To download your own copy press here.
+ 1.866.4.Imagine © 2016 Imagine Communications Proprietary and Confidential[:en]Generate new revenue through subscription and ad-insertion business models
Introduction
“That’s great! But what does it do for me,” is a refrain of frustration that Video Service Providers (VSPs) are increasingly evoking as they roll out new IP video services to satisfy their customers’ TV Everywhere cravings. These services, based on unicast transmission of video to consumer devices, such as tablets, PCs, mobile phones, or set-top boxes (STBs), have become a market necessity for VSPs largely due to competitive pressure and to guard against subscriber churn. But many VSPs are now discovering that these new services are more than just a tool for promoting customer loyalty but an emerging source of additional ARPU (average revenue per user). This paper explains how VSPs can generate new revenue through the thoughtful monetization of new IP Video services that are capable of scaling gracefully and delivering a quick return of investment.
Service Types
This paper is focused on three separate IP-based, Over-the-Top (OTT) services: linear video, Video on Demand (VOD) and Cloud DVR. These services are capable of generating revenue via subscriptions, transactions, or through ad-insertion, as illustrated in Figure 1.
To demonstrate the scale of achievable revenue, this report focuses on a hypothetical VSP with 250,000 subscribers to its linear video service. While revenue results will scale linearly with subscribers numbers, the goal of this document is to show that even a small VSP can generate significant revenue through IP-based services.
These services can also be used to upsell adjunct offerings, such as telephony and security/monitoring. Though an additional source of potential revenue, these adjunct services are beyond the scope of this paper. In addition, this document does not estimate revenue generation through transaction-oriented services, which are dependent on multiple factors.
Subscription Services
A subscription model, which automates an annual or monthly purchasing decision, is beneficial to both consumers and service providers. Figure 2 summarizes typical North American subscription pricing and service uptake rates. These services have different deployment costs, with cloud DVR being the most expensive due to high storage requirements (specifically in North America, where each subscriber’s recordings have to be stored independently). Even in this case, the ROI is measured in months
Transaction Services
Revenue from transactional services, which can be lucrative, is difficult to estimate. A VSP’s potential for success in this area is dependent on multiple factors, such as access to premium sporting events or premium content. A potential windfall for VSPs is emerging interest among content owners to monetize early release window content, e.g. movies that are still playing in theaters. Transactions of this sort can bring in very high fees. But roll-outs are complicated by many factors, including fears of piracy and negotiations with theater distribution channels.
Ad Insertion
For linear television, VSPs share ad opportunities with content owners, each inserting ads on some of the available ad spots. In the North American cable market alone, this is a $60 billion business.
Figure 3 summarizes typical assumptions for factors that influence the return associated with local ad insertion by a VSP.
Note the following clarifications about these assumptions:
- Set-Top Box (STB) peak live concurrency is 50-60%, but multiscreen is typically less.
- CPMs can be higher than presented here, especially as targeting improves. Because these services are unicast, every subscriber can potentially be targeted by more suitable ads than in broadcast, for example.
- Out of the typical 12 minutes per hour of advertising, about 2 minutes is shared with VSPs, leading to 4 ad opportunities.
- This is a conservative estimate of the average number of total hours that are viewed at the average live concurrency (not the average hours viewed per viewer).
Figure 4 uses the OTT linear television assumptions to show associated return. Figure 4 illustrates that even moderate assumptions on either concurrency or CPM can yield significant return.
| Concurrency |
CPM |
Annual Revenue |
ARPU |
| 5% |
$10 |
$2,190,000 |
$8.76 |
| 5% |
$20 |
$4,380,000 |
$17.52 |
| 5% |
$30 |
$6,570,000 |
$26.28 |
| 15% |
$10 |
$6,570,000 |
$26.28 |
| 15% |
$20 |
$13,140,000 |
$52.56 |
| 15% |
$30 |
$19,710,000 |
$78.84 |
| Figure 4: Annual Revenue & ARPU Estimates for OTT Linear Television Ad Insertion |
For cloud DVR services, relevant assumptions are shown in Figure 5.
| Assumptions |
| Subscribers |
250,000 |
| Average cloud DVR Concurrency1 |
1% – 6% |
| CPM2 |
$10-$30 |
| D4 Ad opportunities per hour3 |
24 |
| C3 Ad opportunities per hour |
4 |
| Number of hours viewed per day4 |
10 |
| Percentage of D4 assets5 |
25% |
| Figure 5: Cloud DVR Assumptions |
Note the following clarifications about these assumptions:
- Peak cloud DVR viewing concurrency can hit 20%, but average concurrency over the day is much lower.
- CPMs can be much higher than assumed here, especially as targeting improves.
- After the so-called C3 window (72 hours), all ads can be replaced. C3 ads typically count toward the original live campaign. In our estimates, we count both the C3 campaign (which has fewer ad opportunities, since only the fewer replaced ad opportunities can be monetized) and the subsequent day 4 (D4) campaign (where all the original ad opportunities can be monetized).
- This is a conservative estimate of the average number of total hours in a day that are viewed at the average cloud DVR concurrency (not the average watched per viewer).
- About 75% of all assets are viewed during the C3 window (72 hours). This is what’s left.
Figure 6 shows the returns associated with the above assumptions and illustrates the lucrative revenue potential of cloud DVR services.
| Concurrency |
CPM |
Annual Revenue |
ARPU |
| 1% |
$10 |
$821,250 |
$3.29 |
| 1% |
$20 |
$1,642,500 |
$6.57 |
| 1% |
$30 |
$2,463,750 |
$9.86 |
| 3% |
$10 |
$2,463,750 |
$9.86 |
| 3% |
$20 |
$4,927,500 |
$19.71 |
| 3% |
$30 |
$7,391,250 |
$29.57 |
| 6% |
$10 |
$4,927,500 |
$19.71 |
| 6% |
$20 |
$9,855,000 |
$39.42 |
| 6% |
$30 |
$14,782,500 |
$59.13 |
| Figure 6: Annual Revenue & ARPU Estimates for Cloud DVR Ad Insertion |
For ad-supported VOD services, the revenue is smaller. The assumptions are illustrated in Figure 7.
| Assumptions |
| Subscribers |
250,000 |
| Average cloud DVR Concurrency1 |
3% |
| CPM2 |
$10-$30 |
| Ad opportunities per hour3 |
6 |
| Number of hours viewed per day4 |
2 |
| Figure 7: OTT VOD Assumptions |
Note the following clarifications about these assumptions:
- Peak AVOD concurrency can hit 20%, but average concurrency over the day is lower.
- CPMs can be much higher, especially as targeting improves.
- AVOD can’t support the same ad avails as recorded TV, though in some cases operators try to insert more ad opportunities than assumed here.
- VOD viewing is less than cloud DVR viewing.
The resulting revenue, based on the above assumptions, is lower than the estimates for either linear or cloud DVR services, as illustrated in Figure 8.
| CPM |
Annual Revenue |
| $10 |
$328,500 |
| $20 |
$657,000 |
| $30 |
$985,500 |
| Figure 8: Annual Revenue Estimates for Ad-Inserted VOD |
Conclusion
New OTT video services offer VSPs new and significant monetization opportunities. Based on fairly conservative assumptions, a VSP with 250,000 subscribers has the opportunity to generate annual revenue through new OTT services in the range of $30-$60 million annually. While this paper does not cover precise ROI timelines, it is not unreasonable to anticipate a rapid return of investment for services such as ad insertion and cloud DVR subscription, which offer potentially significant annual revenue.
To download your own copy press here.
+ 1.866.4.Imagine © 2016 Imagine Communications Proprietary and Confidential[:]